JDElite Data Modeler offers design and modeling solutions for a wide variety of use cases. The sections in this guide demonstrate the features of JDElite Data Modeler through screenshots and short video clips. The EXPLORE mode has all of the built-in features. The only difference from the Full Functionality mode is that there is no access to the proprietary built-in file browser and respectively to the file system. You can create your diagrams but in order to save/reopen them you'll need the additional server module. There are built-in sample templates for each diagram type. In the EXPLORE mode they can be edited but not saved. In the Full Functionality mode they can be replicated as diagram files, edited and saved.
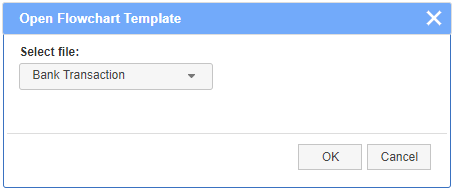
The start page shows the paths to the two supported diagram types. You can switch to one of these types any time by clicking the Start Here button on the top toolbar. In the EXPLORE mode the Open... buttons open the corresponding templates rather than the proprietary file browser as in the Full Functionality mode.
This section covers most of the features common for both types of diagrams. Most of the short video clips refer to flowcharts, but the features displayed in them apply equally to both diagram types. One exception is the horizontal flow direction that is relevant only to flowcharts. The diagram type specific features are explained below in the corresponding sections.
Following is a list of actions, accessible from the top toolbar buttons, as well as from context menus or by mouse/keyboard shortcuts. Most of these actions can also be invoked from the hamburger main drop-down menu in the upper left corner:
![]()
Here is the list of actions:
![]() - Main drop-down menu
- Main drop-down menu
![]() - Start Here: it brings the
start page allowing you to switch to a different diagram type
- Start Here: it brings the
start page allowing you to switch to a different diagram type
![]() - Open the file system browser (see
the File System Browser entry below)
- Open the file system browser (see
the File System Browser entry below)
![]() - Open a template for the selected
diagram type
- Open a template for the selected
diagram type
![]() - Open the Export
dialog to select a database type to export an ERD to a SQL script
- Open the Export
dialog to select a database type to export an ERD to a SQL script
![]() - Undo the latest action (Ctrl+Z)
- Undo the latest action (Ctrl+Z)
![]() - Redo the latest action that has
been undone (Ctrl+Shift+Z)
- Redo the latest action that has
been undone (Ctrl+Shift+Z)
![]() - Delete the selected individual element,
or a selected group
- Delete the selected individual element,
or a selected group
![]() - Copy the selected element or the group
(Ctrl+-C)
- Copy the selected element or the group
(Ctrl+-C)
![]() - Paste the selected element or group
to a location pointed by the mouse (Ctrl+V)
- Paste the selected element or group
to a location pointed by the mouse (Ctrl+V)
![]() - Save the diagram - enabled if there are any
changes from the last save action (Ctrl+S)
- Save the diagram - enabled if there are any
changes from the last save action (Ctrl+S)
![]() - Save the diagram as a new copy
- always enabled (Ctrl+Shift+S)
- Save the diagram as a new copy
- always enabled (Ctrl+Shift+S)
![]() - Refresh the diagram and reset the scaling,
if any
- Refresh the diagram and reset the scaling,
if any
![]() - Open the Search dialog (Ctrl_Shift+F)
- Open the Search dialog (Ctrl_Shift+F)
![]() - Clear the canvas without saving current changes,
if any
- Clear the canvas without saving current changes,
if any
![]() - Navigate to the previous diagram,
if such is available, and ask to save current changes
- Navigate to the previous diagram,
if such is available, and ask to save current changes
![]() - Navigate to the next diagram,
if such is available, and ask to save current changes
- Navigate to the next diagram,
if such is available, and ask to save current changes
![]() - Open the Settings dialog
- Open the Settings dialog
![]() - Open the drop down help menu
- Open the drop down help menu
The editor actions are undoable through an unlimited number of Undo/Redo steps. The undo buffer is cleared by a save action.
The Settings dialog applies to all supported diagram types. It can be invoked at any time
from the Settings icon on the toolbar:
![]()
The General tab of Settings dialog offers several different options. The Horizontal direction applies to flowcharts only. Changes to most of the options will not affect the earlier design work.
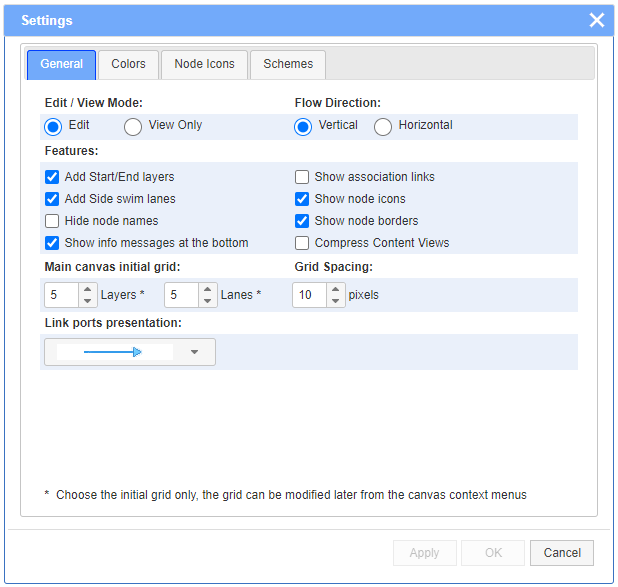
The Colors tab allows to select the background and/or foreground colors, as well as the border colors, of the node types and the other common graphical elements. The selections usually affect the currently opened diagram and will be saved in its output JSON file. These values will be displayed in the diagram the next time the file is open. In addition, any current set of color selections can be saved as a named color scheme from the Schemes tab.

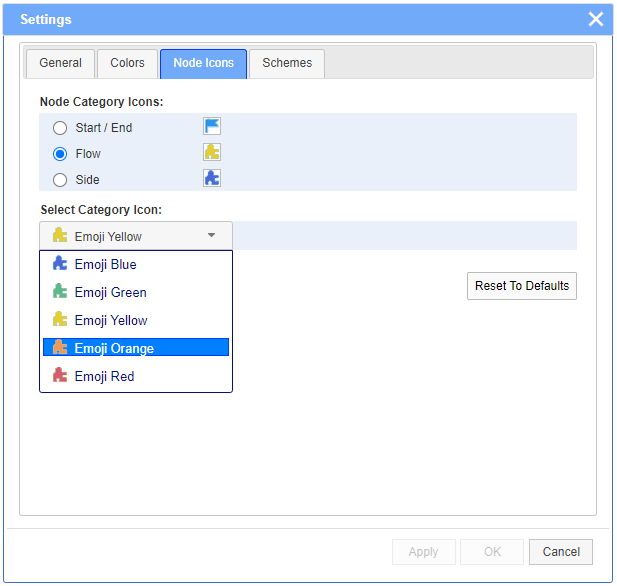
The Node Icons tab allows to choose the nodes icons from a list of images. Nodes are grouped by categories.
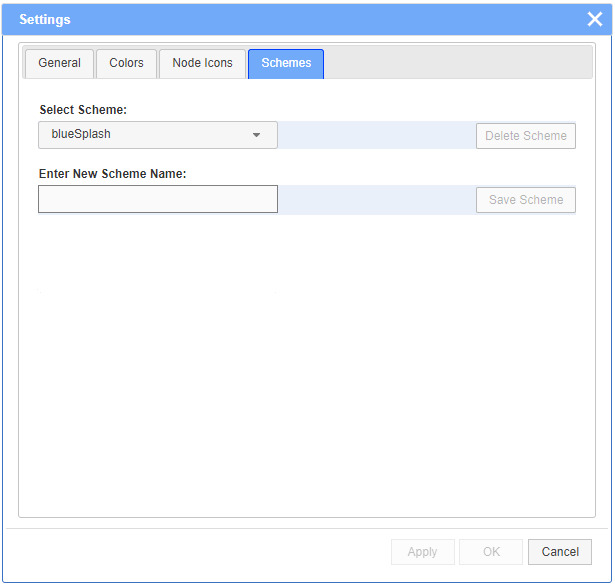
The Schemes tab allows to save named color selections in a local configuration file for further reuse. There are 3 built-in color schemes: default, blueSplash and greenSplash. The selected scheme will be applied when creating new diagrams. However, the specific color selections may be overwritten later on as desired.
The editor has a proprietary file system browser that is accessible as long as a server connection is available. Its full access to the file system makes it possible to easily open, save and delete files, as well as to display, create and delete folders. The created diagrams, in JSON format, can be saved in the existing folders or in newly created ones. Currently the file browser works under Windows. The server connection uses node.js.
NOTE: Due to some current limitations of node.js libraries, the file browser can access only the file structure or the disk partition where the JDElite Data Modeler is installed and launched from. Files and folders with names containing spaces are excluded.
A view of the browser in OPEN mode:
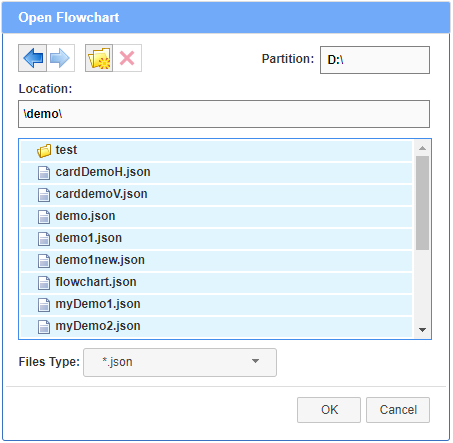
The actions prompted by the buttons on the top of the file browser are as follows:
![]() - Move one level up
- Move one level up
![]() - Move one level down
- Move one level down
![]() - Create new folder
at the current location
- Create new folder
at the current location
 - Delete the selected file of folder
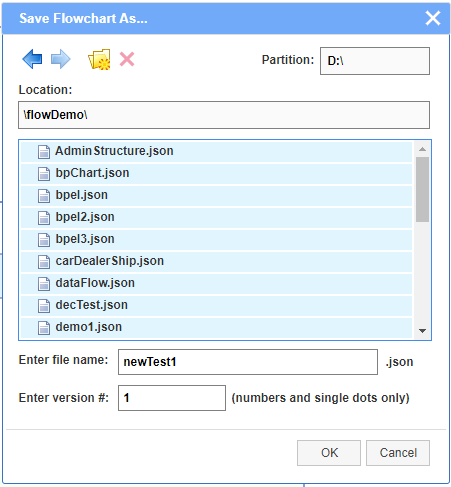
A view of the brouser in SAVE mode:
The layout structure of the canvas is the same for the two supported diagram types.
The nodes are positioned on a rectangular dynamic grid that consists of
layers across the flow direction and
lanes along the flow direction.
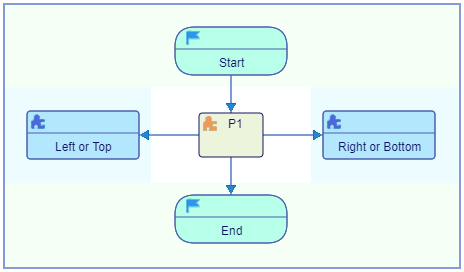
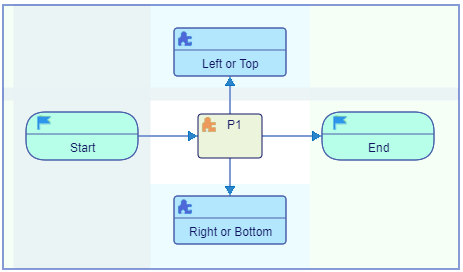
Flowchart diagrams are displayed either vertically or horizontaly. In vertical mode the leftmost
lane is accepting only left/top nodes, and the rightmost only right/bottom nodes.
Switching to horizontal mode, the leftmost lane shows at the top, and the rightmost lahe shows
at the bottom. These lanes are dedicated as swim lanes. They can be added or removed
from the Settings->General dialog.
The switching of the flow direction
is from the large arrow button located in the top
right section above the component palette. This section can be expanded or collapsed by the
small arrow button on the right, as it is shown in the Editor Basics topic.
NOTE: Database ERD use always vertical flow direction and do not expose any swim lanes.
The nodes are allocated in the cells at the
intersections. The connection links are traced along the pipes between the
layers and between the lanes. All these areas are highlighted when the mouse is moved over.
When a node icon is dragged from the palette to the canvas, or when a node is moved to a different
position, only the cells accepting the particular node type are highlighted.
Nodes are assigned names at node creation time. Names have to be unique across the diagram. They can be changed inline any time later. Duplicate names are rejected. Nodes are created either by dragging a node icon from the palette, or by selecting a node item from the context menu on the canvas. The selection options are context sensitive:

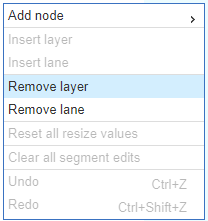
Layers and/or lanes can be added from the canvas context menu when the mouse is positioned on a pipe. Empty layers or lanes can be removed from the context menu:
Single mouse click on a node or on a link displays it as selected. Multiple selections can be made in two ways:
The Copy and Paste actions require one or more selected nodes of the same copy category (see below) and include only the links between them, if any. Paste is activated after the Copy selection. Any combination of the following works on selected nodes:
The copy categories comprise nodes that can be copied together.
Flowcharts include five categories:
Copying between different diagrams is not accepted.
You can delete all of the selected graph elements using any of:
Mouse click outside any graph element cancels all selections, except if pointing to a paste location.

When a diagram is larger than the browser viewable area, the Thumbnail View dialog, invokable
from the top right of the screen, helps to navigate the entire diagram:
![]()
To search for a particular node or nodes in large diagrams, use the Search dialog accessed from the
top toolbar:
![]()
It allows to find a single or multiple nodes by using a
full or partial name, or by matching the appropriate text or pattern in the node content text.

A new node is created either by dragging an item from the palette on the right of the screen to an accepting cell on the canvas, or by positioning the mouse on an empty cell and selecting a node type from the context menu. The menu shows only nodes that are accepted at this location:

The start and end layers, as well as the left and right swim lanes, are optional. They all accept their specific node types from the palette or from the mouse context menus.
The flowchart frame size can be modified from the context menus at any time by inserting new layers or lanes, and/or removing the unused ones:
Build a diagram by simply drag-and-drop nodes from the palette
and by dragging links between the nodes, connecting the popup handles with the mouse.
Note that when selecting(clicking) a popup handle, the handles that potentially can accept
a connection between certain nodes will become lightly highlighted. The connection is accepted
when the connection line dragged by the mouse reaches one of these handles and the highlight color
changes to a darker blue.
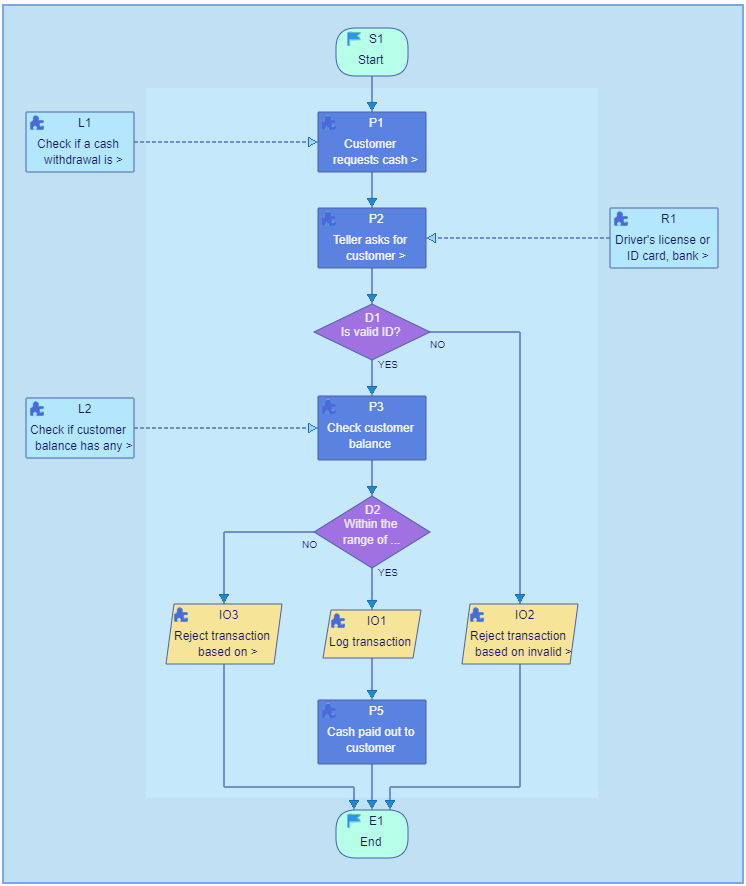
Flowcharts represent the steps of algorithms, processes or workflows, vizualising the
structure of the problems or tasks.
The template shown below represents
a bank transaction process.
When moving the mouse over the node, two editable areas are visualized under the cursor: the node
name field and the node text content field. When double-clicking on any of them, the corresponding
text field opens, accepting the keyboard input for editing.
There are certain spelling rules
regarding the node name. In case of spelling mistakes, an error message comes up below the field.
Edits to these two fields are accepted by pressing the Enter key.
If the text content size is too large, use the context menu on the node
in order to compress the text to only two lines, or, if desired, to expand it back in full:
The editing of these fields can also be done within the Properties dialog invoked from the context menu on the node. Additional text can be attached to the node above and/or below its shape:
The Properties dialog also allows changes to the node colors, adding or removing an icon, as well as hiding or unhiding the node name:
Resizing the nodes horizontally and vertically is easily achieved by mouse dragging one of the sides or one of the corners. The larger sizes can be reset either individually from the node context menu or globally from the canvas context menu:

The data flow direction in flowcharts is either top to bottom or left to right, and can be changed or switched back and forth at any time by double clicking the flipping arrow button in the box on the right of the screen above the palette. The flow direction can be changed from the Settings dialog as well.
![]() - Vertical
- Vertical
![]() - Horizontal
- Horizontal
The flowchart will be rotated and flipped. This does not otherwise affect its content. The flipping preserves the correlation between the flowchart internal directions and the canvas coordinate system:
The Settings dialog offers the option to choose whether to use the start & end lanes or not,
as well as whether to use the side swim lanes or not.
In the case of a vertical flow direction, the side swim lanes appear at the top and at the bottom
of the diagram,
while in the case of a horizontal direction they appear on the left and on the right.
There are specific start, end, left/top and right/bottom nodes.
The central layers and/or lanes can be added or removed (only when empty)
from the context menus on the canvas.
The link Properties dialog can be invoked from the link context menu or by double clicking the link itself. This dialog allows to attach labels to the link or to change its color.

The nodes can be moved, as well as copied and pasted, to different grid cells.
To reassign the link ports,
you can move them to different nodes by mouse-dragging to the appropriate connection
ports.
By enabling the Show association links> option in the Settings->General dialog, you can
assign weak relations between certain nodes.
The Decision nodes have two outputs: YES and NO, and can accept multiple inputs.
The input(s) location is fixed at the top of the shape in a vertical layout or on the left
of the shape in a horizontal layout.
The positions of the outputs can be chosen by double-clicking the node. The popup box
offers six different options for the YES/NO outputs selectable by the arrow buttons in clockwise or
anti-clockwise direction:
IMPORTANT: JDElite Data Modeler is self-contained and does not require any database server. It processes data from files and stores the results in files.
The Database ERDs (entity-relationship diagrams) represent the databases physical structure. In essence, an ER diagram contains two object types: entities and relationships. The entities correspond to database tables and in the ERDs they are modeled as diagram nodes. The nodes show the detailed table designs. The relationships between the entities are modeled as links between the nodes.
The current relational databases on the market use as a common language the SQL, however they all have certain implementation differences. In order to reconcile them for a unified ERD design, JDElite Data Modeler provides a common UI and handles the differences internally. Here we introduce the basic concepts of relational databases. For the full understanding of all details, you should consult the corresponding database documentation. Otherwise JDElite Data Modeler covers all intricacies of SQL Server, Oracle, MySQL, PostgreSQL, DB2, and SQLite databases.
An ERD created in JDElite Data Modeler is saved as a file in JSON format. The diagram can be exported to a specific SQL script ready to be used to create the corresponding database schema. Vice versa, a database SQL schema script can be imported to JDElite Data Modeler, translated to a JSON diagram file, visualized and modified as needed.
Database tables contain records (table rows) and columns. A table record is an instance of the represented entity. All records in a table have identical structure. For example, the records in the CUSTOMER table below are instances of the customer entity and each record corresponds to a particular customer.
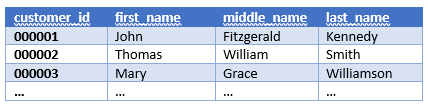
All record fields in vertical direction constitute the table columns. Columns, respectively the fields in a column, depending on the particular content, represent specific properties: name, data type, data length, etc. In the above example, the record fields in the CUSTOMER table are customer_id, first_name, middle_name and last_name. These are the database table column names.
Each ERD node in JDElite Data Modeler represents the structure of a database table in its own table form. The rows in the diagram node table correspond to the database table columns, and the columns in the diagram node table correspond to the database column properties.
The structures of relational databases are determined by the primary and foreign keys.
A primary key is a column or a group of columns (composite primary key) that ensure unique
row identification in the database table. The values of the primary keys for the different records
cannot be duplicate or null. If a primary key contains multiple columns, the combination of values
in each record should be unique for it to be valid. A table can have only one primary key.
A foreign key is a column or a group of columns that together with a primary key of another
table represent a reference between the two tables. In other words, the foreign key in one table
is said to have a reference to a primary key in another table. There could be multiple
foreign keys from different tables referencing the same primary key.
As mentioned earlier, the rows in the diagram table node correspond to the database table
columns. The columns in the diagram node show the property values of each database column.
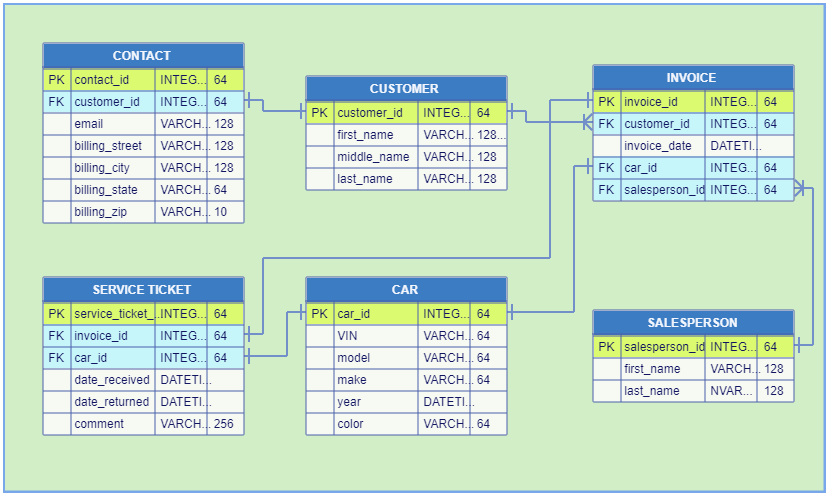
In the picture below, the first record field in the CUSTOMER table, named customer_id, is
the first row of the CUSTOMER diagram node. This is the primary key of this database
table. It is tagged with PK in the first column of the node.
The first record field in the CONTACT table, named contact_id, is
the first row of the CONTACT diagram node. This is the primary key of this database
table. It is tagged with PK in the first column of the node.
The second record field in the CONTACT table, named customer_id, is
the second row of the CONTACT diagram node. This is the foreign key of this database
table. It is tagged with FK in the first column of the node.
The popup handles on the PK row of one node and on the FK row of another node offer the
choice to create a link between the two diagram nodes. This link is an essential
feature of the relational databases. It establishes and ensures the referential integrity between the
referencing column and the referenced column.
The small vertical bars at the both ends of the link below show the particular cardinalities.
They define the possible number of occurrences of the primary entity customer associated
with the possible number of occurrences of the foreign entity contact. In the example below
each customer can have only one contact associated with him and each contact corresponds to only
one specific customer. This is called one-to-one relationship. Other types of cardinalities
are illustrated later.
A new DB table node is created either by dragging an item from the palette on the right to an accepting cell on the canvas, or by selecting an item from the canvas context menu displayed on an empty cell. In both cases there are three node choices, which differ only by the initial number of columns. The most convenient number of columns can be chosen later in the table node editor. The minimal number of columns cannot be less than two.

The node name can be edited by double-clicking the name field.
The DB table node editor is invoked by double-clicking either the table title bar or a chosen table row. You can add, edit or remove a row, as well as rearrange the order of the rows, using the buttons at the top right. These buttons are enabled or disabled depending on which table row is selected. You can also define database table indexes and database column constraints. The editor actions are demonstrated below.
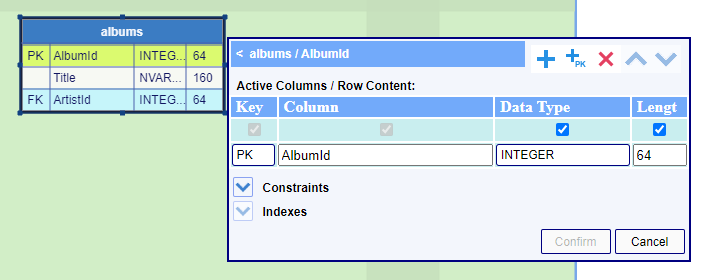
The node columns Key and Column Name are preselected to show the minimal size of the table node and cannot be unchecked. The remaining two columns can be displayed as needed. These selections do not affect the actual content of the node table row. The four designated node columns are common for all existing relational databases. They are as follows:
Key - designates the database column as either primary or foreign key, or none
Column Name - the database column name
Data Type - data type of the content of all fields in this column
Length - the length of the data of all fields in this column
The buttons on the toolbar of the DB table editor are as follow:
![]() - Add a new empty row
- Add a new empty row
![]() - Add an additional row for primary key
- Add an additional row for primary key
![]() - Delete the row if there is
no reference to it
- Delete the row if there is
no reference to it
![]() - Move the row one step up
if the row has no primary key assigned
- Move the row one step up
if the row has no primary key assigned
![]() - Move the row one step
down if the row has no primary key assigned
- Move the row one step
down if the row has no primary key assigned
Here is an example how to create a database table node:
And here is an example how to rearrange some rows in a database table node:
Within database modelling, cardinality is the numerical relationship between rows in one database table and rows in another. It defines the number of occurrences of a primary entity associated with the number of occurrences of a foreign entity. The cardinality is represented graphically by the so called crow's foot symbols at the ends of the connection. There are six commonly accepted relationships symbols:
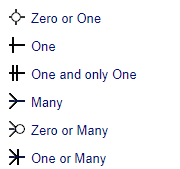
There are three main types of cardinality relationships: one-to-one, one-to-many (many-to-one) and many-to-many.
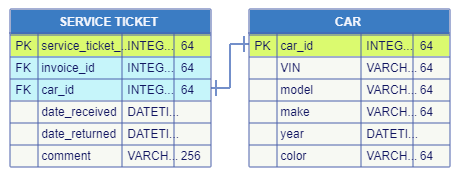
One-to-one cardinality
One example was the CUSTOMER to CONTACT relation shown before under the Primary and Foreign Keys title. This is the case when one entity is split in two in order to present the information in a more comprehensible way. Another example would be the car to service ticket relation in a car repair shop:
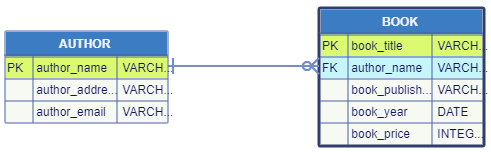
One-to-many cardinality
This is when one instance of the first entity may be related to more than one instances of the other entity. An example would be when we keep an authors catalog and we need to show the relation between an author and her/his books:
Many-to-many cardinality
In a different scenario, in a library, we need to establish the relations between the plurality of authors and the plurality of books. In this case we can preferably use an additional join table with two one-to-many relations as follows:

The AUTHORS_BOOKS table contains two foreign keys pointing respectively to the AUTHORS and BOOKS tables. These two foreign keys together act as a composite primary key for the AUTHORS_BOOKS table. See more details about composite keys in the next topic.
As it was pointed out in the Notations and Cardinality topic, some foreign keys may be grouped together and act as a composite primary key. In the scenario of the handling the plurality of authors and the plurality of books in a library, simply relating an author to a book turns out to be not sufficient. Most of the authors have more than one book, and some book titles are repeatedly used by different authors. In this case the pair author-book is an entity by itself. In order to identify it uniquely we need to introduce the AUTHORS_BOOKS table. This table has two foreign keys: author_name and book_title. They will represent a composite primary key, meaning that together they identify uniquely any author-book entity.
Here is an example how to assign a composite primary key. You need to double-click the table node title bar to open the DB table node editor, then to click the Composite primary Key button. The preselected type is PRIMARY KEY. The dropdowns of the fields Column1, Column2, Column3 contain the list of all foreign keys present in this table node. You have to select two or more different foreign keys. Optionally you can specify a name for this composite key.
Database constraints are used to specify rules for data in a table. They can be column-level or table-level, and can refer to a single column or multiple columns. Constraints are used to limit the type of data that can be included in a table. This ensures the accuracy and reliability of the data in the table. If there is any violation between a constraint and the action on the data, the action is aborted.
Here are examples of the most common database constraints:
- PRIMARY KEY constraint: Uniquely identifies each row in a table, requiring that the values in this column be a combination of a NOT NULL and UNIQUE
- FOREIGN KEY constraint: Connects data across multiple tables, based on a common column or columns. It is a field (or collection of fields) in one table, refering to the PRIMARY KEY in another table
- UNIQUE constraint: Prevents duplicate values from being entered into a column, but allows null values
- NOT NULL constraint: Ensures that a column will never contain an invalid value
- CHECK constraint: Specifies a requirement that must be met by each row in a table, and can refer to a single or multiple columns
- DEFAULT constraint: Allows to define a value to be placed into a column when a new row is inserted
There are some additional clauses that complement some of the constraints:
- REFERENCES: Complements the FOREIGN KEY constraint
- AUTO_INCREMENT: A unique number will be generated automatically when a new record is inserted into a table
Here is an example how to assign some constraints for a database table column. You need to double-click the table node row that corresponds to the database column:
And here is an example how to assign a REFERENCES constraint. You need to double-click a table node row representing a FOREIGN KEY. Using the dropdowns, select an existing table and the column name from that table representing the PRIMARY KEY of that table. By confirming this assignment, a graphical link will be created in the diagram.
There is a two-way synchronization between a created link and the REFERENCES constraint: creating a link will also automatically assign a REFERENCES constraint.
Database index is an optional structure, associated with a column or columns on a table,
that can speed up the access to the data. Indexes are structures stored in the database that users
manage using SQL statements. They are used to support database performance.
Database key is a column or set of columns that uniquely identify rows in a table. They
are used to maintain data integrity. A key declaration is a constraint.
Examples of keys are the primary keys, the foreign keys and the composite primary keys, all that
were explained above.
The documentation for keys and indexes is specific for each database implementation.
The corresponding database manuals provide the interpretations and detailed information for the usage.
It is recommended that you consult the database documentation.
Here we show how to specify the creation of these structures using JDElite Flowchart Editor.
In a SQLite database, in order to create an index, you need to double-click the
table node title bar. You can define an index to be UNIQUE by selecting the appropriate checkbox.
Here is an example showing how to create an index for SQLite database:
In a MySQL database, JDElite Flowchart Editor provides an uniform way to assign indexes and keys. They are all defined at table level. Key is normally a synonym for index. There are several key flavors, like:
The PRIMARY key can be defined either on table level or on a column level.
The FOREIGN key is defined at column level.
Here is an example showing how to create an index for MySQL database:
JDElite Data Modeler supports the import of database schema scripts in SQL format
of several databases: SQL Server, Oracle, MySQL, PostgreSQL, DB2, SQLite.
The ERDs of these databases can be exported to schema scripts in SQL format as well.
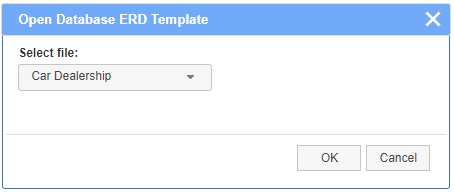
There are built-in ERD test templates for these databases. You can make changes to a template,
then export it to your hard disk.
Import from SQL schema
Export to SQL schema